

Manuali VOIspeed®
Obtain a diagnostic plot
TRACK OF A CALL
To carry out a rigorous debugging of a call with problems, the mere description of the phenomenon in words is not sufficient: this must support the trace of the call, which instead provides in a precise and often unambiguous way what happened during the call. To export the trace of a call, in the case of the On Premises platform, the diagnostics must be enabled by activating the “Diagnostics enabled” option. For the On premises platform do this:
- As super administrators of the PBX (no company must be selected), go to the System section.
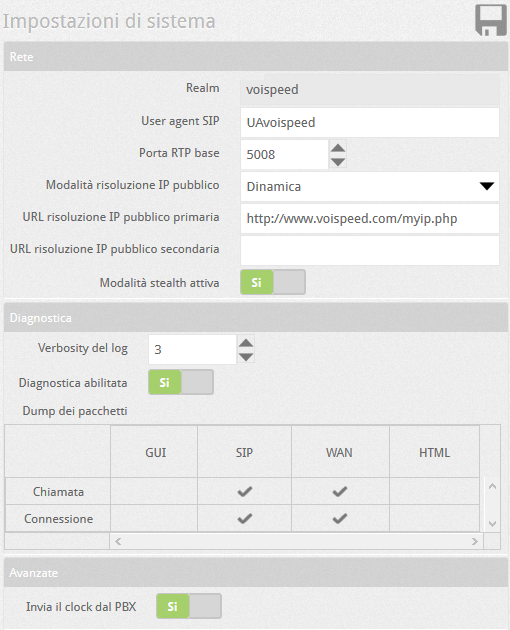
- Within the grid, select SIP in correspondence with the “Call” line
- Perform a call test until the problem is replicated
- Go to the Call Reporting section and locate the offending call. Note: the call filter is set to Today – Incoming + Outgoing: if the call was between extensions and / or occurred on another day, modify the filter accordingly.
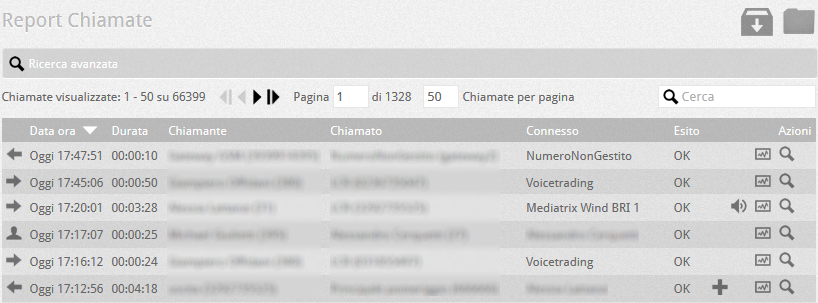 and enter the diagnostic area by clicking on the button
  .
.
- Export the file in html with the button.
 .
.
TRACE OF A SIP REGISTRATION
The procedure is identical to the previous case, except that in the case of SIP registration, at the first point it is necessary to enable the SIP interface connection detail. Subsequently
- Attempt to register the device with a restart, possibly waiting for the set Register timeout to expire.
- Go to the User Monitoring section, locate the user associated with the terminal and enter the diagnostic area with the button .
- Export the file in html with the button. So far it might already be enough.
In some cases the complete log could also be useful, therefore at the explicit request of technical support
- Go to the Toolbox – diagnostics section.
- Select the log file folder at the top right

- Download the latest PbxLogX.txt text log and zip it
- Communicate the IP address and the extension of the terminal or the offending VoIP operator to technical support
UCLOUD PLATFORM
The diagnostic concepts are also identical in the new UCloud platform: to activate the diagnostics, simply enter the Configuration → Company menu and activate the diagnostics in the general configurations.