How Can We Help?
How to monitor the activity of a response group from the UI
In this article we will see how to view the activity of a response group from its own UI.
From your UCloud UI it is possible to view the traffic and activity of the individual components of the switchboard response groups in real time.
The user who intends to use this feature must be enabled by the switchboard administrator (see User creation and configuration).
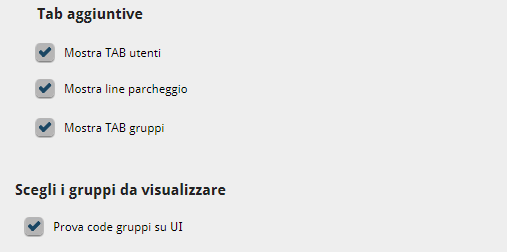
If enabled, the user can decide to view the tab that allows you to monitor the activity of a response group in real time; the settings in question are found in the Settings section (accessible via the icon
|
 |
After completing this section, a new TAB with an icon ![]() ; will appear on the UI; by clicking on it you can access the view of the groups chosen with your activity. Let’s see in detail all the features available with this option.
; will appear on the UI; by clicking on it you can access the view of the groups chosen with your activity. Let’s see in detail all the features available with this option.
| The star at the top next to the group name allows access / exit to the group; if active (green star) the user has become part of the group and can directly manage the calls sent to it.For each group displayed, it is also possible to call the group directly (handset icon), forward a call to it blindly or with supervision (forwarding icon) and open its details (for more information on group details, see How to monitor the details of a pickup group from your UI). |  |
In this panel, for each group it is possible to monitor:
|
 |
|
|
All these values are accompanied by a status (bottom bar) that lights up progressively to give visual information of the situation, progressing from green (situation under control) to red (alert status, group in management difficulty. |
 |
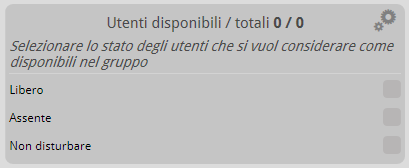
In particular, for information relating to Queued Calls, it is possible to set when to trigger the alert status by clicking on the button
|
 |


